Just Launched! — Release Burndown Chart for Agile Teams
“Will this ship on time?” I bet your team is used to hearing this question. It should be simple enough to answer. But considering how many features and moving parts are in every release, it is not always a clear “yes” or “no.”
But it should be — because dates matter. We want to help you answer the “will it ship on time” question with more confidence.
We are excited to announce a new progress chart for tracking releases. This chart provides a detailed burndown view, so agile teams can visualize what work has been accomplished and what is left to be done.
From a single view, you can better forecast release dates. This provides a realistic outlook, helping you understand whether you need to adjust the scope to deliver functionality on time. And the best part is that the release progress chart is tightly integrated with the rest of Aha! This means that the updates you make to features and estimations of required effort are automatically reflected on this chart.
Here is how you can combine the existing strategy and roadmapping functionality of Aha! with an easy-to-read agile burndown chart:
Visualize progress and completed work Visualize exactly what has been accomplished and how much work is remaining in your release. This will help ensure that all teams are aligned on the timing of the launch. Of course, not all teams measure work the same way. So, the burndown chart provides multiple approaches to track progress — including the number of features and requirements and the work measured by time or points. (To show work by time or points on the chart, turn on capacity planning and start using it in Aha!)

Navigate to Release Details Progress at the bottom of the screen to view and track your release using different metrics.
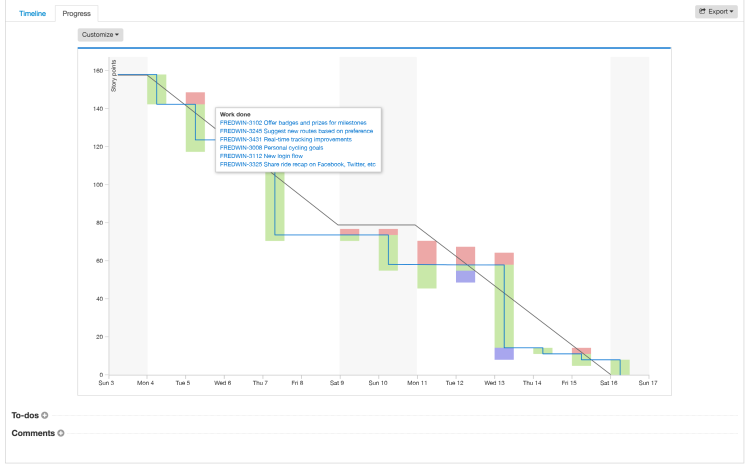
Adjust scope to hit deadlines The gray line on the chart shows how work should be progressing throughout the release to finish on time (assuming you work at about the same pace throughout the release). It is displayed alongside the real-time views of the actual progress.
The progress chart helps you see what is really going on. With this insight, you can counteract challenges like the dreaded scope creep to get back on track or keep cross-functional teams in the loop if you see that the release will be delayed. When the scope is increased, it is represented as a red bar. When the work is completed, the bar is green, and when you reduce scope by moving it out of the release, the bar is purple.

You can use the releases progress chart to identify where you have fallen behind and adjust the scope.
Report on delivery dates You can also report on and share the progress of a release to communicate expected timelines to internal teams, partners, and customers. Like all reports in Aha!, this progress chart can be exported as an image, PDF, or added to an Aha! Notebook to share via a secure web presentation.

Quickly communicate delivery dates to the teams that are counting on the release.
Analyze progress for future forecasting Release planning is both an art and a science. Every product manager knows that it is always a work in progress, and obstacles and delays occur when you are trying to solve tough problems. But product managers can only improve what they plan for and measure. With the progress chart, you have an audit trail of both your planning skill and how the team has progressed. It makes it easy to analyze previous releases to understand feature team capacity and accurately plan future work.

Improve future releases by analyzing the work the team has done in the past.
So, next time someone asks if your release is going to ship on time, you will have an immediate — and more accurate — answer.
Whether adjusting scope to hit a critical deadline, more accurate planning for future releases, or better communication throughout the team — the release progress chart gives you the information you need to be a better product manager.
Burn it down.
Sign up for a free Aha! trial — be happy The new release burndown chart is available to all Aha! customers. If you are not already an Aha! customer, sign up for a free 30-day trial of Aha! now to see why over 100,000 users trust Aha! to set product strategy, create visual roadmaps, and prioritize releases and features.
