Just Launched! — Show the Percent of Work Completed on Roadmaps and Reports
“I think we are on track.” Those words should strike fear in the heart of any product or marketing team. Progress updates should not be vague! When folks ask for an update, you need a firm answer. And this requires knowing how much work the team has actually completed — so everyone can move forward decisively. Today’s enhancement gives you a way to do exactly that.
You can now track the percent of work completed on records in Aha! to visualize progress on roadmaps and reports.
Reporting on work as it happens can be complex. Especially when big initiatives or programs are broken into smaller chunks and spread across multiple teams. You need to understand what is happening with each individual work item to know if the overall effort is actually on track. So we created a new way to track progress in Aha!
You can now add a progress field to your records and track the percent complete — either by entering the progress manually or automatically calculating it from related information. The progress field is enabled by default, but you can also choose to show or hide it on each record. And if your team is not ready to track progress, you can disable the field in your workspace configuration settings.
A quick overview will help you get started. In the bulleted list below, we are using record terminology from a product workspace. Note that if your team is using a marketing workspace, these records will be labeled differently. These are the ways you can calculate progress across record types:
Goals — child goals, initiatives, releases, master features, or features
Initiatives — child initiatives, releases, master features, or features
Releases — master features, features, release phases, or to-dos
Release phases — features or to-dos
Master features — features or to-dos
Features — requirements, remaining estimate, or to-dos
Now that we have that baseline understanding, let’s get into the details of what is possible. Here is how you can track and visualize progress in your workspace:
Track features underway Enter the percent completed for each feature. In the example below, we calculated the progress from requirements. Using auto-calculate ensures that any updates to the underlying child records are included in the overall percentage at the parent level.
Customize your feature cards to include a visual progress bar.
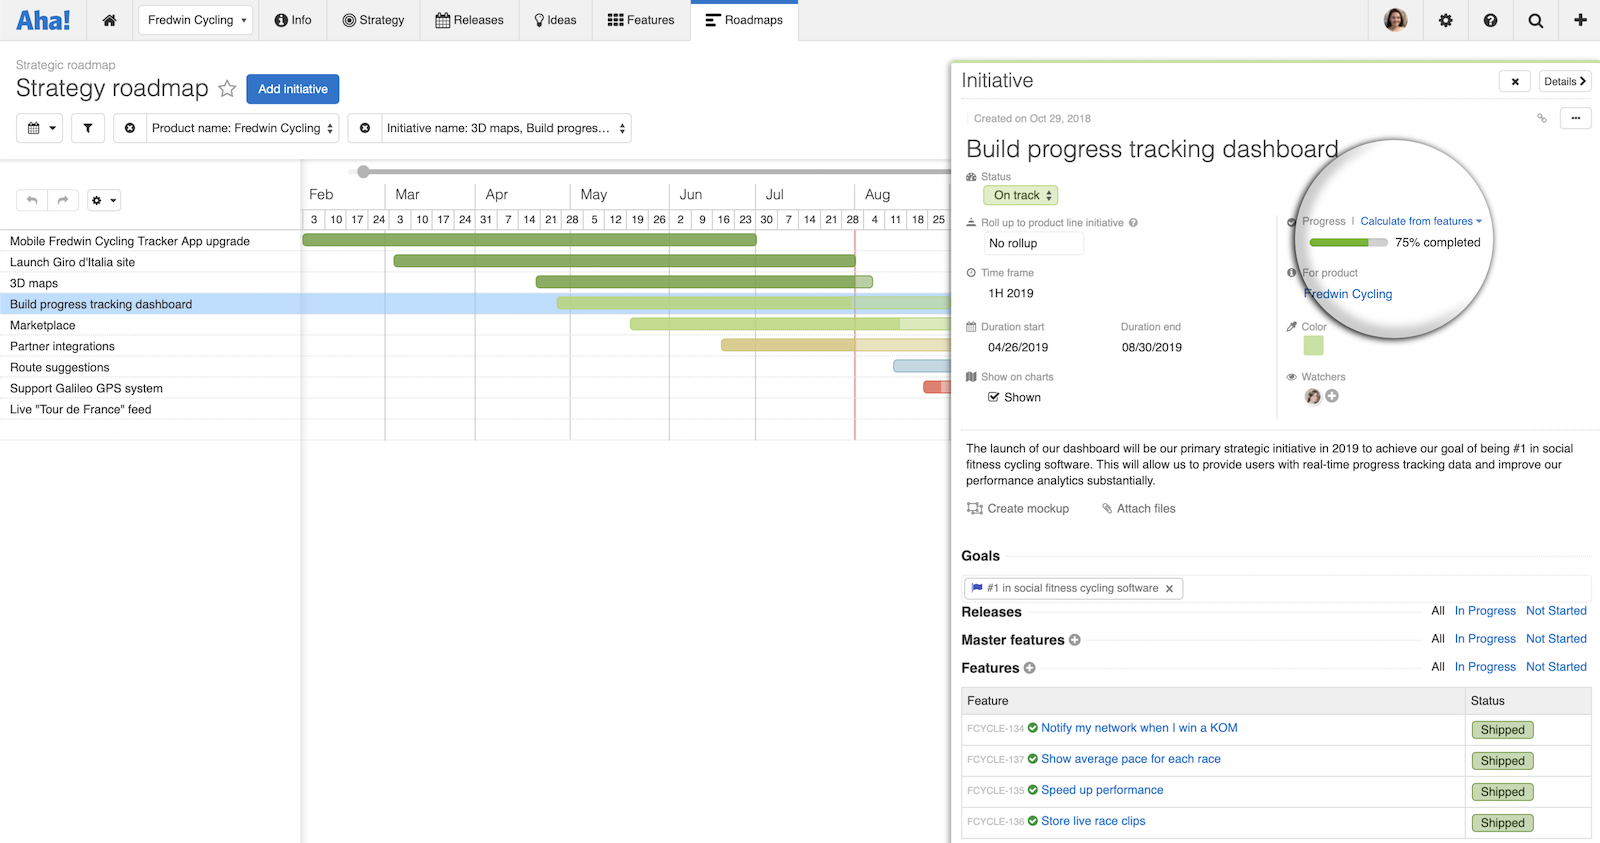
Monitor strategic initiatives Initiatives often require work across multiple teams, which can make it challenging to understand and accurately communicate overall momentum. The example below shows how you can use a strategy roadmap to visualize the pacing across all your initiatives in one view. We calculated progress from features. There are two ways you can do this. One way is to calculate the average percent of work completed across the underlying features. The other is to calculate from the overall number of completed features.
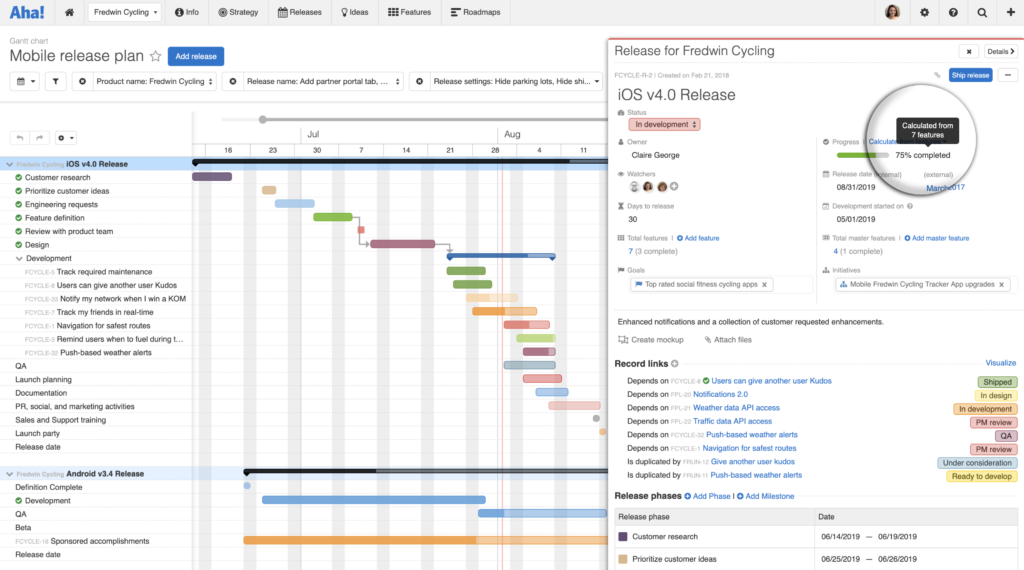
Show release timing on a Gantt chart Instantly see if you are on track to meet your release dates. Open the drawer view to see more details about each release. In this example, we can see the release is 75 percent complete based on the progress of seven underlying features.

You can also choose to hide progress on the Gantt chart.
Visualize progress in reports Why should roadmaps have all the fun? Include the progress bar and percent complete field in your list reports and pivot tables too. This is useful when you want to glance across multiple records at once — such as the features status report shown below.

You can perform calculations on the percent completed field in list reports.
Your roadmap should tell a complete story about what the team has accomplished and what is coming up next.
There is no better feeling than when you are getting work done. So, start tracking the progress of everything the team is producing. You will love seeing the progress bar move to the right as you deliver against your plan.
Sign up for a free Aha! trial — be happy The ability to view progress on roadmaps is available to all Aha! customers. If you are not already an Aha! customer, you may want to sign up for a free 30-day trial or join a live demo to see why more than 250,000 users trust Aha! to build and market lovable products.
